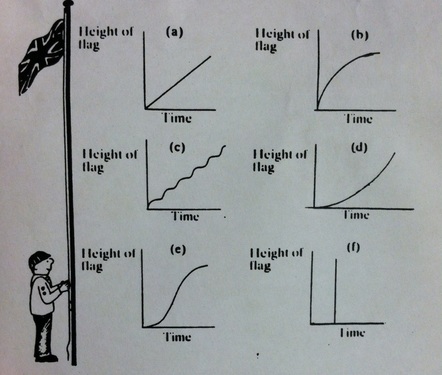
 1) Each of the graphs represent the time it takes as the height of the flag increases. In graph A, the flag is raised at a linear rate, meaning the time and height increase by the same intervals; consistently. In graph B, C, D and E, the lines are interrupted by a certain variable. The rate the flag is raised and the time it takes increases with unpredictable numbers. In graph F, the height of the flag is raised in no time at all. The height and time exponentially grow.
2) Graph E shows the situation most realistically. Hoisting a flag may take a moment of extra time in the beginning and end of the process. The time and height usually do not increase at the exact same rate (linear). 3) Graph F is the least realistic. It is impossible to raise a flag fully in no time at all.
0 Comments
Leave a Reply. |
AuthorWrite something about yourself. No need to be fancy, just an overview. Archives
February 2017
Categories |
 RSS Feed
