Wheel and Axel Lab Report
The observations I recorded during the introduction to the experiment were different from any observations I have taken this year. I noticed that the axel was increasing its speed exponentially, and my group was able to confirm that later through graphical analysis. When the axel was being pushed up the rail, I noticed that it was gradually slowing down until it reached a stop, then quickly increased its speed back to its original position. Based on these observations, we investigated the axel's position over time passed. Our purpose for choosing position versus time was to figure out when the axel was traveling the fastest and with the position versus time graph we could do just that. From collecting position and time data, we were able to also see the axel's velocity at any given point by finding the slope of the position and time graph. Additionally, we could tell what the axel's acceleration was at any given moment by finding the slope of the velocity versus time graph.
Materials: Wooden axel, two aluminum rods, meter stick, dry - erase marker, wet - wipe, textbooks (to create unbalanced surface), metronome.
We were able to successfully carry out this experiment but not before we collected some interesting data as seen in our graphs.
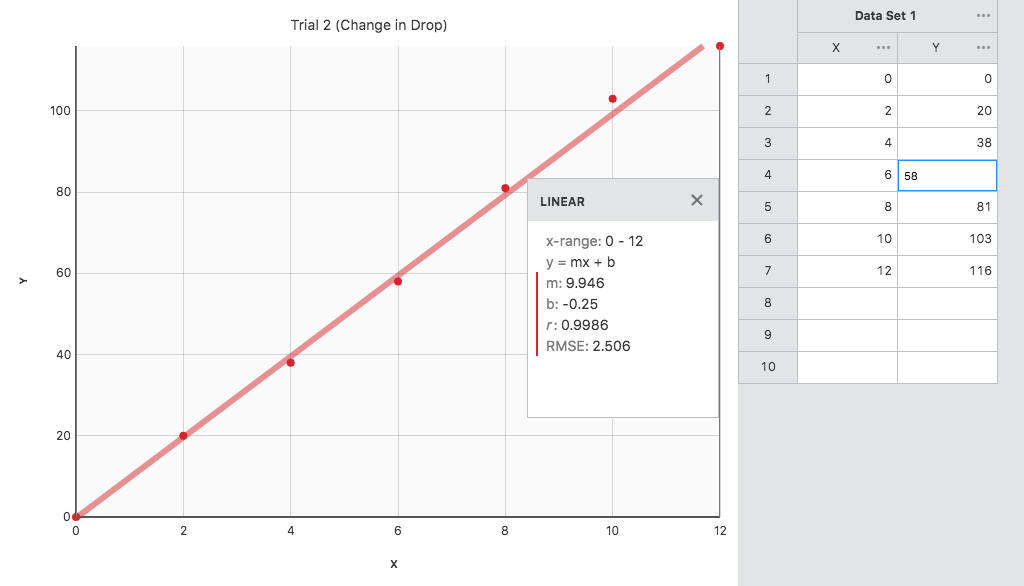
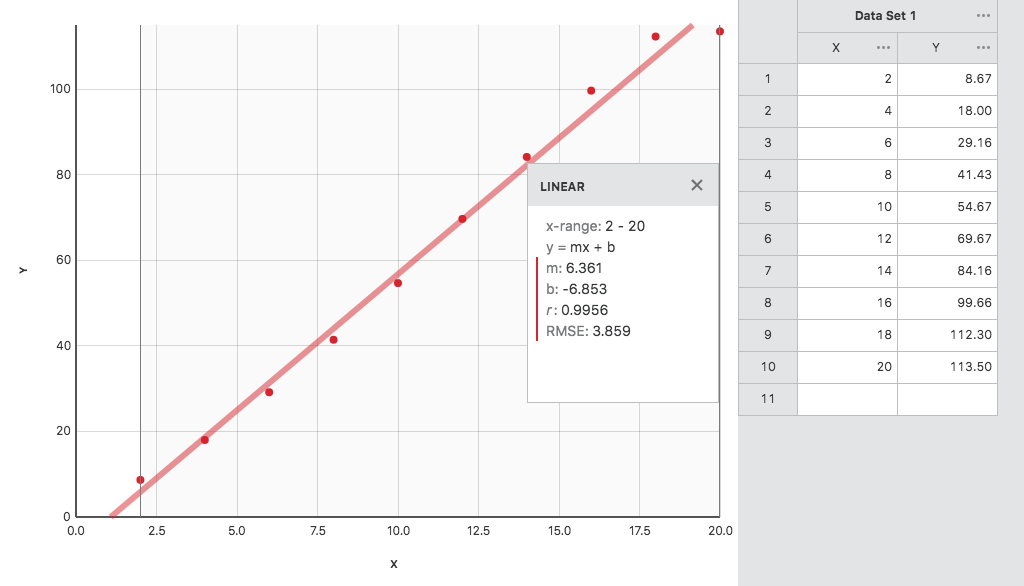
The first position versus time graph was supposed to turn out as exponentially increasing and ours turned out to be very close to linear. This was due to inconsistencies in starting and stopping the axel, as well as the motion of the axel too, it wiggled and was a little inconsistent throughout the experiment.
|
|
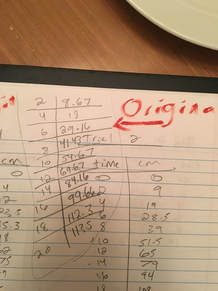
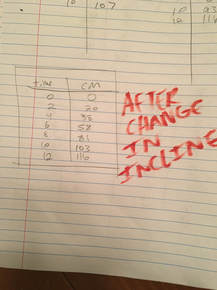
In order for data to be exponential, the y values have to be considerably larger for every x. In both of our data tables that were used to produce the Vernier Graphs, the values do not show that. Yes, there is an increase but not large enough for us to see that it acts exponential.
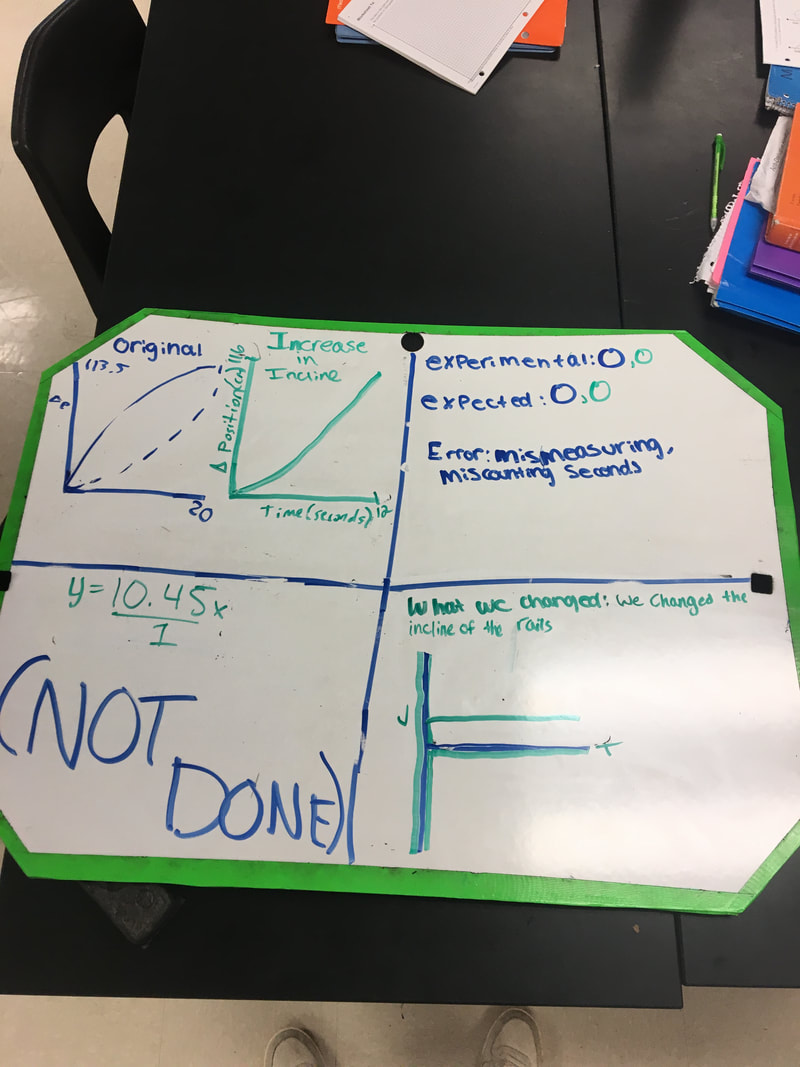
This lab helped me understand how to connect position and velocity to acceleration. I know that if i find the slope of each line I can eventually find acceleration. Also, in the previous units we would work with constant velocity, even constant position. Every v vs. t graph was a straight horizontal line. Now, velocity is becoming linear and a new variable, acceleration has come in to play. What happens when acceleration becomes linear? What does the slope of an acceleration line represent? This lab helped me think about those questions and struck my curiosity. Although we had lots of error in the heart of the experiment I feel confident that our group could go back and get way better results. To start, we should have picked a better axel to use and set a position 0 for each trial. We moved position 0 around too much which threw off our data. We should have been more precise in listening in to the ticks of the metronome and marking the spot that corresponds to the axel's location. With these quick fixes, our results would have turned out much clearer.
This lab helped me understand how to connect position and velocity to acceleration. I know that if i find the slope of each line I can eventually find acceleration. Also, in the previous units we would work with constant velocity, even constant position. Every v vs. t graph was a straight horizontal line. Now, velocity is becoming linear and a new variable, acceleration has come in to play. What happens when acceleration becomes linear? What does the slope of an acceleration line represent? This lab helped me think about those questions and struck my curiosity. Although we had lots of error in the heart of the experiment I feel confident that our group could go back and get way better results. To start, we should have picked a better axel to use and set a position 0 for each trial. We moved position 0 around too much which threw off our data. We should have been more precise in listening in to the ticks of the metronome and marking the spot that corresponds to the axel's location. With these quick fixes, our results would have turned out much clearer.
